Chapter 7 — Demand and Supply Curves
Cambridge International AS & A Level Economics (9708) · Unit 2.1 · 4th edition coursebook
Learning objectives
- Define the meaning of effective demand.
- Explain the importance of individual and market demand and supply.
- Explain the factors that affect demand.
- Explain the factors that affect supply.
- Analyse the causes of a shift in the demand curve (D).
- Analyse the causes of a shift in the supply curve (S).
- Distinguish between the shift in the demand or supply curve and the movement along these curves.
Key terms
- price mechanism
- The means of allocating resources in a market economy.
- consumers
- Individuals or households who buy goods and services for their own use or for others.
- market
- Where buyers and sellers get together to trade.
- demand
- The quantity of a product that consumers are willing and able to buy at different prices per period of time other things equal, ceteris paribus.
- supply
- The quantity of a product that producers are willing and able to sell at different prices within a time period, other things equal, ceteris paribus.
- demand curve (D)
- A line plotted on a graph that represents the relationship between the quantity demanded and the price of a product.
- market demand
- The total amount demanded by consumers.
- demand schedule
- The data from which a demand curve is drawn on a graph.
- movement up and down (along) a demand curve
- Shows how quantity demanded responds to a change in price.
- normal goods
- Where the quantity demanded increases as income increases.
- inferior goods
- Where the quantity demanded increases as income decreases.
- substitute
- An alternative good.
- complement
- A good consumed with another.
- joint demand
- When two goods are consumed together.
- supply curve (S)
- A line plotted on a graph that represents the relationship between the quantity supplied and the price of the product.
- supply schedule
- The data from which a supply curve is drawn on a graph.
- subsidies
- Direct payments made by governments to producers of goods and services.
- indirect tax
- A tax levied on goods and services, such as a general sales tax.
- extension of demand or supply
- An increase in the quantity demanded or quantity supplied.
- contraction of demand or supply
- A decrease in the quantity demanded or quantity supplied.
7.1The price mechanism and markets
In a market economy the price mechanism is the central means of allocating resources. The price mechanism sends signals between consumers and producers. Oversupply in a market signals that fewer resources should be allocated to that product; a shortage signals that more resources are needed. The mechanism is self-regulating: as long as it is working efficiently, it does not require government intervention.
The everyday use of the word 'market' often suggests a physical location — a street market or shopping centre. Economists use the term more broadly. At the core of any market is trade: a seller has something to offer and a buyer wants to buy it. Whenever people come together to exchange, there is a market.
Markets in this broader sense include the housing market (where property is rented, bought and sold), the labour market (where labour services are bought and sold), agricultural markets (for coffee, tea, cotton, etc.), the oil market, the stock market (where shares are traded), the foreign exchange market (where currencies are traded), and the online markets where countless goods and services are now exchanged. None of these requires a physical location; the market is the trading process itself.
An understanding of the market leads naturally to demand and supply. Buyers determine demand; sellers determine supply. In every market, the interaction of the two determines what is produced, how it is priced, and how resources are ultimately allocated.
Rising prices and shrinking affordability indicate that demand has grown faster than supply. On the diagram, higher equilibrium price and quantity are produced by a rightward shift in demand that traces upwards along the existing supply curve — a movement up the supply curve. Option B captures this. The demand curve has shifted, not been moved along (ruling out A), and inferences about elasticity (C, D) cannot be drawn from price alone.
7.2Demand
Demand refers to the quantity of a product that buyers are willing and able to buy at different prices per period of time, ceteris paribus.
Each part of the definition matters:
- Quantity — the numerical amount of the product being demanded.
- Product — a general term covering any tradable item: a good, a service, foreign currency, financial assets.
- Buyers — also called consumers. Economists can study an individual's demand for a product, but it is usually more useful to aggregate (sum) all individual demand curves into a market demand curve.
- Willing to buy — buyers must actually want a product before they will enter the market for it. This is called notional demand.
- Able to buy — notional demand must be backed by purchasing power before it counts as effective demand. Sellers only sell if buyers can pay. When economists talk about demand they mean effective demand.
- Different prices — price is central to the market. As the price of a product rises, ceteris paribus, fewer people judge it to be worth buying.
- Per period of time — demand is always time-related. Saying 20 units were sold is meaningless without specifying the time period (per minute, per week, per year).
- Ceteris paribus — other things equal. Many factors influence demand. Holding the others constant is the only way to isolate the effect of any one of them.
The law of demand assumes everything except the good's own price is held constant — income, prices of other goods, tastes, and so on. Option C – the price of the good – is precisely the variable being allowed to vary, so it is not among the 'all other things'. A, B and D are the standard ceteris paribus conditions held fixed when isolating the price–quantity relationship.
7.3The demand curve
The definition of demand can be represented graphically by a demand curve (D). The data behind such a curve is called a demand schedule — a table showing, for each price, the quantity that consumers are willing and able to buy per period of time. Plotting that schedule on a graph yields the demand curve.
An individual's demand curve shows how a single buyer's demand varies with price. The market demand curve is the horizontal sum of all the individual curves in that market — it shows how the aggregate demand of every consumer in the market varies with price.
Figure 7.3 shows a market demand curve for personal computers. The curve illustrates two important features:
- An inverse (negative) relationship between price and quantity demanded. When price rises, quantity demanded falls; when price falls, quantity demanded rises. This is shown by movements up and down the demand curve.
- The relationship is continuous and time-based, holding all other factors constant (ceteris paribus).
Be careful to distinguish 'quantity demanded' from 'demand'. The demand curve as a whole is 'demand'. A change in the product's own price moves us up or down the existing curve — this changes the quantity demanded but not demand itself.
Market demand is the horizontal sum of all individual demand curves: at each price, the quantities demanded by each consumer are added together along the quantity (horizontal) axis. Option B – the horizontal axis only – states this aggregation rule. Vertical summation applies to public-good demand, not ordinary market demand.
7.4The factors that affect demand
Price is not the only factor that influences demand. The main non-price determinants are income, the price and availability of related products, and fashion, taste and attitudes.
Income
For most products, demand rises when income rises. These are called normal goods — most cars, housing, restaurant meals, and good-quality clothing fall in this category. For some products, the relationship goes the other way: demand falls as income rises. These are inferior goods — typically lower-quality foods and used clothing. As consumers become better off, they substitute towards higher-quality alternatives.
The price and availability of related products
Related products fall into two categories:
- Substitutes — alternative goods that satisfy the same want. A rise in the price of one substitute usually causes demand for the other to rise. The strength of the effect depends on how close the substitutes are.
- Complements — goods consumed together in joint demand. A change in the price or availability of one complement affects demand for the other. A rise in the price of fuel, for example, typically reduces non-essential car use.
Fashion, taste and attitudes
Fashion, taste and attitudes are harder to model because they are personal. Each consumer has their own likes and dislikes, shaped over time by experience, advertising, and culture. Favourable shifts in taste — for example, a positive media report or a fashionable trend — increase demand. Unfavourable shifts — health scares, changes in fashion — reduce it.
An inferior good is one whose demand falls when incomes rise and rises when incomes fall. Option A – a decrease in consumer incomes – therefore shifts the demand curve for an inferior good to the right. Lower income tax (B) raises disposable income (reducing inferior-good demand); cheaper substitutes (C) reduce demand; and the good's own-price change (D) causes a movement along the curve, not a shift.
7.5Supply
Supply refers to the quantity of a product that producers are willing and able to sell at different prices per period of time, ceteris paribus. The definition has the same structure as the definition of demand, but reversed:
- Sellers may be manufacturers or other parts of the supply chain. There may be one supplier or many; when many are aggregated, the result is the market supply.
- Willing and able to sell at different prices — firms must gain from selling. When prices rise, firms are usually more willing and able to supply more. This gives a positive relationship between price and quantity supplied.
- Per period of time — supply, like demand, is always time-based and is measured over a consistent period.
- Ceteris paribus — other factors affecting supply are held constant.
7.6The supply curve
The supply definition is represented by a supply curve (S), derived from a supply schedule. Figure 7.4 shows a market supply curve for PCs.
The market supply curve shows two features:
- A positive (direct) relationship between price and quantity supplied. As price rises, quantity supplied rises; as price falls, quantity supplied falls. Changes in price move the market along the curve.
- The relationship is continuous, time-based, and holds ceteris paribus.
As with demand, distinguish a movement along the supply curve (caused by a change in the product's own price) from a shift of the curve (caused by a change in any other factor). The same vocabulary applies: an increase in quantity supplied along the curve is called an extension; a decrease is a contraction.
7.7The factors that affect supply
Price is not the only factor affecting supply. The main non-price determinants are costs of production, the size and nature of the industry, prices of other products, government policy, and other factors such as weather in agricultural markets.
- Costs of production — supply decisions are driven by costs. Labour, energy, transport, and worker productivity all matter. Substituting capital for labour can also reduce costs. A fall in costs shifts supply to the right; a rise shifts it to the left.
- The size and nature of the industry — as an industry grows, more products are supplied. Growth attracts new entrants and may push prices down, sometimes causing some firms to exit. In some industries, suppliers may deliberately restrict supply to keep prices up.
- The price of other products — firms watch competitors. A competitor lowering its price tends to reduce sales (and supply) from firms that hold their prices steady. A competitor raising its price has the opposite effect.
- Government policy — a new indirect tax on a product typically reduces supply; subsidies usually increase it.
- Other factors — agricultural supply is heavily affected by weather (storms, frost, drought). A poor harvest can shift supply sharply to the left; good growing conditions can shift it to the right.
7.8Causes of shifts in the demand and supply curves
The demand and supply curves are drawn on the assumption that all factors other than the product's own price are unchanged. When any of those non-price factors does change, the entire curve shifts to the right or to the left.
Shifts in the demand curve
Figure 7.5 shows the two cases. A shift to the right (a) is an increase in demand; a shift to the left (b) is a decrease in demand. Causes are summarised below:
| A shift to the right may mean… | A shift to the left may mean… |
|---|---|
| an increase in income (normal good) | a decrease in income (normal good) |
| an increase in the price of substitutes | a decrease in the price of substitutes |
| a decrease in the price of complements | an increase in the price of complements |
| a favourable change in fashion, taste and attitudes | an unfavourable change in fashion, taste and attitudes |
Shifts in the supply curve
Figure 7.6 shows the supply equivalents. A shift to the right (a) is an increase in supply; a shift to the left (b) is a decrease in supply:
| A shift to the right may mean… | A shift to the left may mean… |
|---|---|
| a decrease in costs of production | an increase in costs of production |
| growth in the size of the industry | decline in the size of the industry |
| a decrease in competitors' prices | an increase in competitors' prices |
| a decrease in indirect tax or an increase in subsidies | an increase in indirect tax or a fall in subsidies |
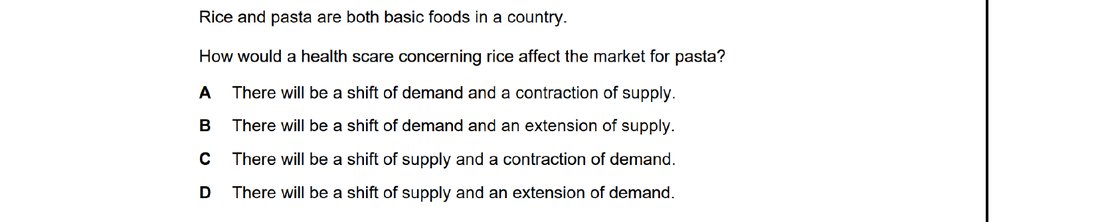
Rice and pasta are substitutes — a health scare about rice makes consumers switch to pasta, shifting pasta's demand curve to the right. Higher demand raises pasta's price, which incentivises producers to supply more along the existing supply curve: an extension of supply. Option B – a shift of demand and an extension of supply – combines both effects correctly.
7.9Distinguishing a shift from a movement along the curve
The distinction between a shift and a movement along a curve is one of the most common sources of confusion in AS Economics. The rule is straightforward:
- A movement up or down a demand or supply curve shows how the quantity demanded or supplied responds to a change in the product's own price. An increase in quantity demanded or supplied is called an extension; a decrease is a contraction.
- A shift of the entire demand or supply curve occurs when one of the non-price determinants changes. A rightward shift is an increase in demand or supply; a leftward shift is a decrease.
Key concept link — time
A movement along a demand or supply curve or a shift in a demand or supply curve takes place over two time periods. For example, if there is an unexpected increase in the quantity demanded leading to a rise in price, it will take time for suppliers to produce more to meet this increase.
End-of-chapter practice
Past-paper questions from CIE 9708. Pick A, B, C or D. Answers are saved on this device — press Download report (PDF) at the top to save them.
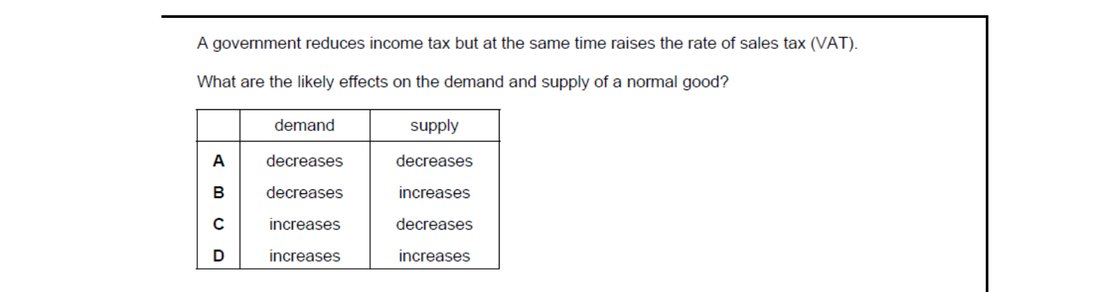
Lower income tax raises disposable income, increasing demand for a normal good. A higher VAT, however, raises the price firms must charge to maintain margins — equivalent to a rise in production costs — which shifts supply to the left, decreasing supply. Option C – demand increases, supply decreases – matches both effects.
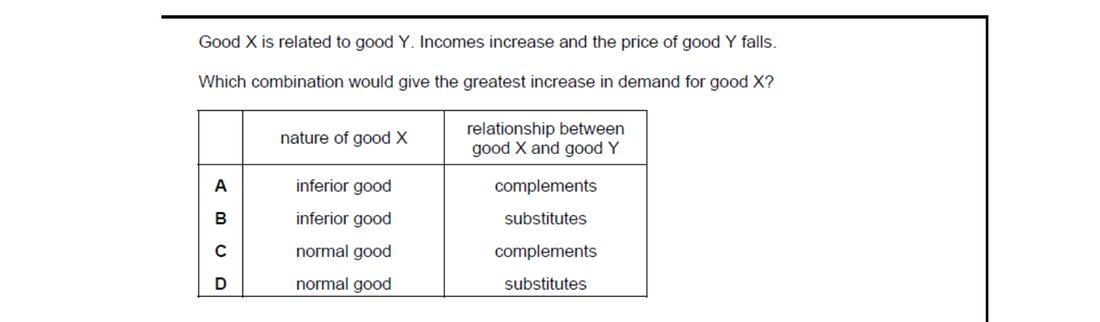
Demand for good X rises most when X is a normal good (rising income raises its demand) and Y is a substitute (a fall in Y's price would normally reduce X's demand, but the income gain outweighs it only when Y is a substitute and the income effect dominates). Option C – normal good with complement Y – means a fall in Y's price increases the joint use, raising demand for X, while higher income also raises demand. Both effects pull demand for X up together.
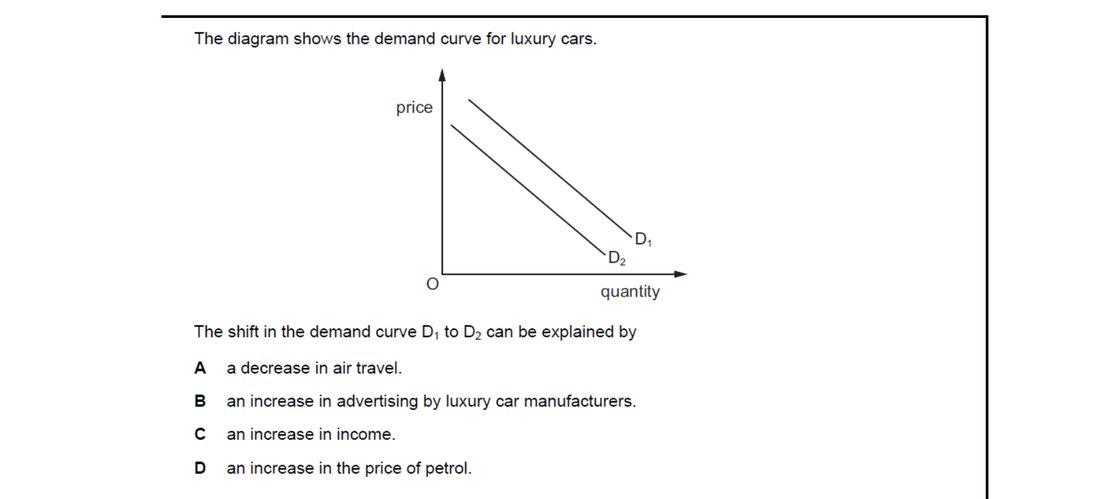
Petrol is a complement to cars: when petrol becomes more expensive, running a car costs more, reducing demand for cars and shifting the demand curve left. Option D captures this complementary relationship. Higher incomes (C) would shift demand right (luxury cars are normal goods), advertising (B) would also raise demand, and demand for an unrelated good like air travel (A) would not directly shift the car demand curve.
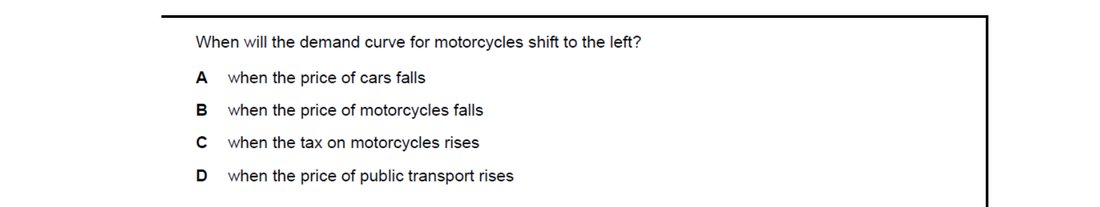
Cars and motorcycles are substitutes: if cars become cheaper, consumers switch to cars and demand less of the substitute, motorcycles, shifting motorcycle demand to the left. Option A captures this substitute effect. A fall in motorcycle prices (B) causes a movement along the demand curve, not a shift; higher motorcycle taxes (C) and dearer public transport (D) would reduce demand only weakly or push it the other way through the complement/substitute logic, so A is the cleanest leftward shift.
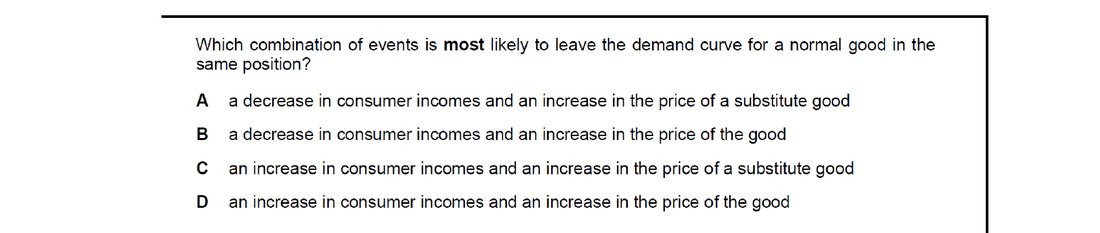
To leave the demand curve unchanged, the income effect and substitute-price effect must offset each other. Option A – falling incomes (which lower demand for a normal good) combined with a higher substitute price (which raises demand) – pulls demand in opposite directions and can leave the curve in roughly the same position. The other rows push demand the same way, shifting the curve in one direction.
Attempt the practice questions above to build your score.
Self-evaluation checklist
After studying this chapter, you should be able to:
- Describe the market mechanism.
- Understand that the buying side of the market is demand.
- Construct a demand curve for an individual firm or for an entire market.
- Explain the factors that affect demand.
- Understand that the selling side of the market is supply.
- Construct a supply curve for an individual firm or for an entire market.
- Explain the factors that affect supply.
- Explain that a movement along a demand or supply curve takes place when a change in price causes a change in the quantity demanded or supplied.
- Analyse how a shift of the demand or supply curve occurs when there is a change in any of the non-price factors that determine demand or supply.
Want more practice? Drill this chapter's past-paper MCQs (127 questions) →